Satellite-based remote sensing has revolutionized the measurement of evapotranspiration, but computer models need to be constantly refined to be reliable. An IWMI scientist has compared competing models to come up with a benchmarking framework that could lead to greater accuracy.

Yann Chemin studied tropical agricultural management as an undergraduate and natural resource management for his master’s degree.
But since the mid-1990s, Chemin, a tall 39-year-old Frenchman with a distinctive goatee, has spent his time in geographic information systems, with a specialty in ET — as in evapotranspiration not extra-terrestrial although satellites fit squarely into the equation as well.
“I’m sitting between sciences here – water and computer programming,” Chemin said recently as he proudly pointed to a 24-core server next to his desk. (For the uninitiated, that’s a rather innocuous looking computer tower that contains 24 independent central processing units). “The way I like to promote myself is as a technical science researcher.”
Chemin’s fulltime job is doing GIS work for Colombo-based International Water Management Institute, a CGIAR Consortium Center. He has a doctorate degree in GIS.
But he’s spent a large chunk of his free time since 1997 on ET – examining satellite images, ground data and using that incredible computer processing power to compare models designed for the agricultural sector. Chemin is trying to develop a framework that can adjust for the strengths and weaknesses of each model depending on the conditions, such as the climate or availability of electricity for irrigation.
Evapotranspiration, a critical part of the water cycle, represents the loss of water in the air through evaporation, and from soil and plants. Measuring it accurately can help scientists predict precipitation patterns, set up more water-efficient irrigation schedules and monitor climate change.

Photo: NASA
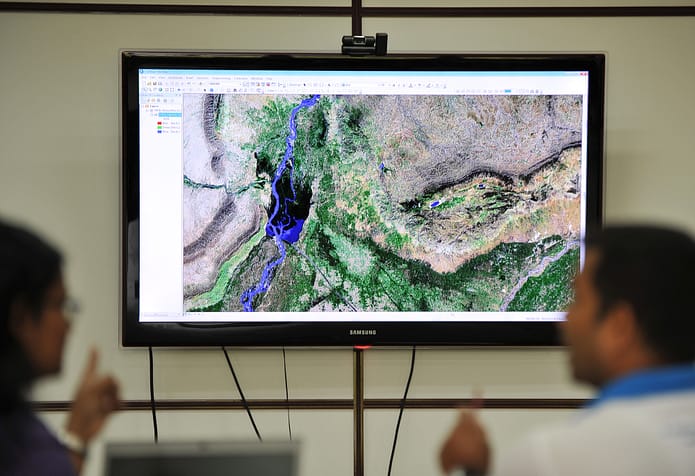
Remote sensing aided by satellite images has revolutionized ET measurement since the early 1970s, with the launch of the first Landsat mapping satellite. Scientists suddenly were able to examine landscape data such as vegetation on a scale previously unprecedented and over an extended period of time.
The images essentially enable one to receive a snapshot of a plant’s health from the sky.
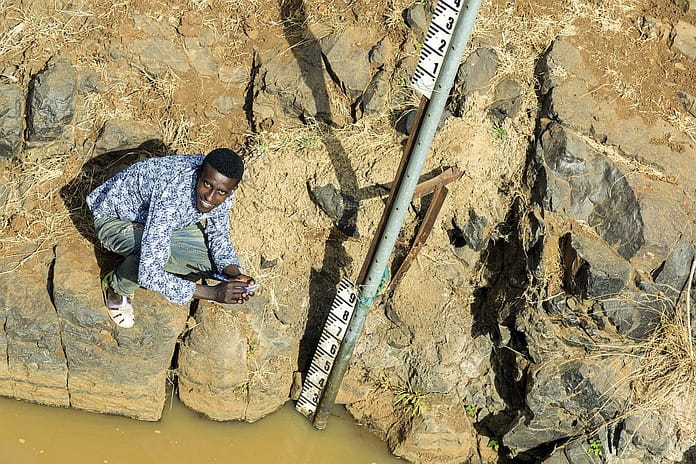
Formerly, one had to use equipment called lysimeters to take measurements on the ground – usually by growing plants in a soil tank attached to a weighing device.
But some of the remote sensing ET models for the agricultural sector now are decades old. A 1970s model, for example, doesn’t take into account that India’s irrigation system is overloaded because of double cropping, population pressures and climate change.
“What I’m setting up is a way to compare the models,” Chemin said. “No one has gotten into each agricultural ET model – what are the benefits and weaknesses of each of them.”
His open-access paper on the benchmarking framework has been downloaded more than 2,000 times in the past year or so, with the U.S., Brazil and China the leading destinations. http://www.intechopen.com/books/evapotranspiration-remote-sensing-and-modeling/a-distributed-benchmarking-framework-for-actual-et-models
His work, to date, has focused particularly on the Murray Darling Basin in Australia and Sri Lanka, crunching tens of thousands of satellite images in a matter of days. The images from the Landsat and MODIS satellites are publicly-available on a daily basis. The images are analyzed pixel by pixel.
“These (ET) models can tell us when the plant is 22 percent (water) stressed. When it hits 50 percent, you’re really in trouble,” Chemin said.
That’s a signal that a farmer needs to irrigate more or risk crop failure. A juvenile plant under such stress, for example, may result in a 20 to 40 percent drop in yield. The models do have around a 20 percent margin of error, he said.
By carefully comparing vegetation, temperature, cloud cover and other factors, computer models can be developed that can accurately predict ET based on remote sensing data alone. But Chemin also looks at available ground data and, in the case of Australia, used an expensive piece of equipment on the ground.
There are constraints to his system. The satellite images used rely on thermal infrared or heat-related sensing, so cloud cover can result in gaps of data. For example, it’s easier to examine irrigation systems in Iran than in the Philippines. But if one accumulates enough data, one can fill in the gaps, Chemin said.
Some organizations use a far simpler method to plan irrigation, such as relying just on ground data and experience. Chemin recounted being snubbed by a tea plantation owner in Sri Lanka.
Still, interest remains high in Chemin’s work – including from various government officials, large agricultural companies and even a U.S. technology company.
Chemin wants to promote the tool as a public good. But he says he has a ways to go based on his pilot project in Australia.
“I made my own model in Australia but I’m not satisfied with it,” he said. But he added: “I will prove that this works.”


