Local mapping of irrigated areas in South Africa’s garden province
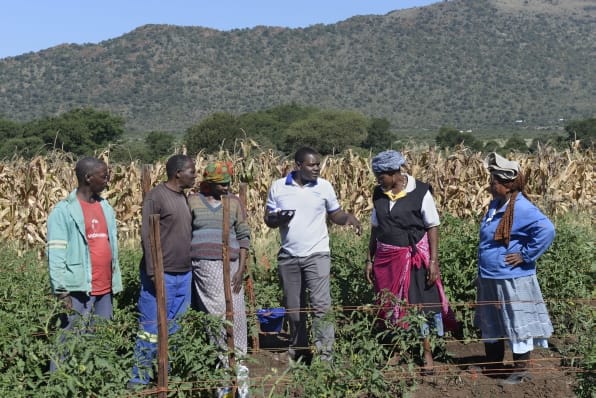
Across sub-Saharan Africa, national governments and regional organizations have set ambitious targets for expanding irrigation to help bolster food security. The Comprehensive Africa Agriculture Development Program (CAADP), for example, envisages an increase of at least 5 million hectares by 2025.
South Africa is no exception to the general trend. The country´s National Development Plan strongly emphasizes irrigation, including hotly debated interventions that aim to improve the lot of smallholder farmers in particular. Yet, here and throughout the continent, a lack of reliable data and information seriously handicaps such efforts.
Unless planners have an understanding of how and where irrigation is practiced today, how can they promote and monitor more efficient management of scarce water resources tomorrow? And how can they be sure that irrigation is being managed in such a way that it helps achieve food security, while reducing agriculture´s ecological footprint.
A matter of scale
Researchers with the International Water Management Institute (IWMI) have started providing answers through a collaborative effort with South Africa´s Department of Agriculture, Forestry and Fisheries (DAFF) and the Limpopo Department of Agriculture and Rural Development (LDARD). They carried out a comprehensive assessment of irrigation during 2015 in an area referred to as the “garden of South Africa” because of its abundant production of a wide variety of fruits and vegetables. The results are reported in a recent IWMI Working Paper (no. 172), titled Mapping irrigated areas in the Limpopo Province, South Africa.
This study builds on pioneering efforts begun at IWMI in 2007, when Institute researchers published the first global map of irrigated areas. In 2012, they began using satellite imagery to map irrigated and rainfed areas of Africa and Asia. A succession of studies over the last decade has demonstrated the validity of remote sensing applications at different scales – global, regional and river basin. This technology offers the further advantages of speed and low cost.
Despite dramatic progress in the use of remote sensing to study land use, however, the resulting maps remain highly uncertain. The problem is compounded by discrepancies between data sources at the local level. Typically, reporting systems rely on estimates that bubble up through ¨layers of national administrative systems,” as the IWMI Working Paper puts it, and are highly subject to errors and bias. Getting reliable estimates of the area under small-scale informal irrigation is particularly tricky.
The real picture
The study in South Africa responds to these limitations by zooming in on specific regions through a combination of advanced remote sensing techniques and improved methods for ground-based collection and verification of data.
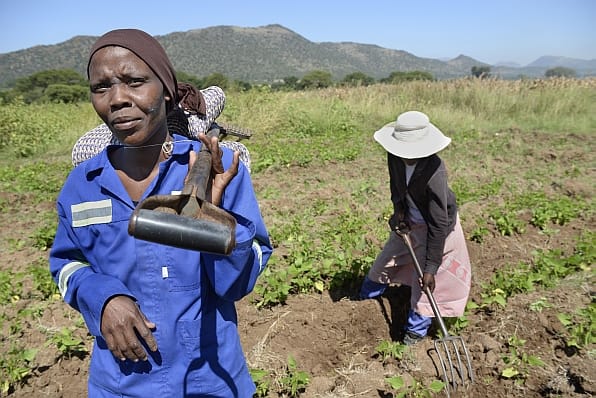
A key advantage of this approach is that it maps the areas that are actually irrigated (i.e., where crops are growing and irrigation water is supplied) rather than the area equipped for irrigation, according to official statistics. There can be profound differences between the two. In some cases, the actual irrigated area may exceed the area equipped because of widespread informal irrigation in places where agriculture is fragmented. Elsewhere, the actual irrigated area may be smaller, reflecting inadequate maintenance of large public irrigation systems.
In Limpopo Province, for example, researchers found that, of the 164,000 hectares equipped for center-pivot irrigation (through major government and private investment), only 47,000 hectares were actually irrigated in the winter of 2015. Even more surprising was the finding that smallholder farmers in the province’s former homelands had 97,471 hectares under irrigation, while government databases included only the 20,000 hectares that formed part of public smallholder irrigation schemes. According to a forthcoming IWMI Working Paper, informal smallholder irrigation accounts for an area four times larger than that of the public schemes. By revealing such discrepancies, local mapping can offer clues about what the problems are and how they can be addressed.
A further strength of the local mapping approach is that it entailed significant technical capacity building for staff of IWMI´s partner organizations. The study thus represents a meaningful step toward consistent, near real-time reporting on the status of irrigation, using open-source remote sensing data. Replicating the approach in other provinces could provide the basis for building a national system to assess irrigation development.
Read the report:
Cai, Xueliang; Magidi, J.; Nhamo, Luxon; van Koppen, Barbara. 2017. Mapping irrigated areas in the Limpopo Province, South Africa. Colombo, Sri Lanka: International Water Management Institute (IWMI) 37p. (IWMI Working Paper 172)


