Mapping risks and estimating impacts on people and agriculture
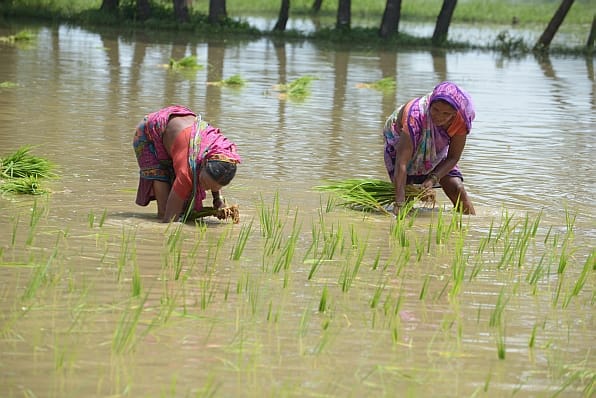
Extreme climate events are taking a heavy toll in countries around the world, destroying lives and livelihoods. Since the late 1980s, the frequency of such disasters has increased – from an average of 195 per year during 1987-1998 to 338 per year during 2000-2011, according to researchers at the Centre for Research on the Epidemiology of Disasters (CRED) in Belgium.
In response, governments are giving high priority to disaster risk reduction, alongside their efforts to mitigate climate change by curbing greenhouse gas emissions. To reduce risks effectively and equitably, however, they urgently need quantitative methods to assess the vulnerability of specific populations to multiple climate-related hazards. Such methods will provide national disaster management organizations with a stronger basis on which to target risk reduction aid and allocate finance for climate adaptation in line with climate justice principles.
Beyond global snapshots
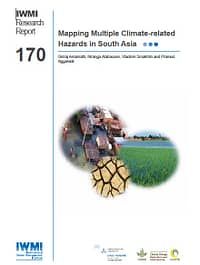
The International Water Management Institute (IWMI) has just given a boost to such efforts with a new research report titled Mapping Multiple Climate-related Hazards in South Asia. The study was launched recently at a policy dialogue organized by IWMI jointly with the Government of Bihar, India; the Indian Council of Agricultural Research (ICAR); Japan’s Ministry of Agriculture, Forestry and Fisheries; and two CGIAR Research Programs – Water, Land and Ecosystems (WLE), which IWMI leads, and Climate Change, Agriculture and Food Security (CCAFS)
Bihar is the country’s most flood-prone state, having suffered agricultural losses with an estimated value of US$340 million over the past 12 years. It is the logical testing ground for index-based flood insurance under a project being carried out with the aforementioned CGIAR Research Programs.
“Countries in the region must coordinate actions to cope with adverse climate impacts, such as seasonal floods, drought, landslides, cyclones and sea-level rise,” says Giriraj Amarnath, lead author of the IWMI report and leader of the Institute´s Water Risks research group. At a global level, the World Bank and other organizations have conducted large-scale analysis of natural disasters, making it possible to pinpoint hotspots. But according to Amarnath, the resulting “global snapshots” are not detailed enough to guide local risk reduction efforts.
In South Asia, the assessment of multiple risks has increased over the last decade, though most studies are confined to the state or district level. In contrast, the IWMI study closes major knowledge gaps by offering a detailed approach to map climate hazards and identify areas at risk on a regional and sub-national scale.
Vulnerable people and places
Relying on the vulnerability assessment framework of the Intergovernmental Panel on Climate Change (IPCC), the IWMI study uses a combined index (based on hazard, exposure and adaptive capacity) to identify areas that are susceptible to extreme risk. For this purpose, researchers used data on the spatial distribution of climate-related hazards in 1,398 districts of Bangladesh, Bhutan, India, Nepal, Pakistan and Sri Lanka.
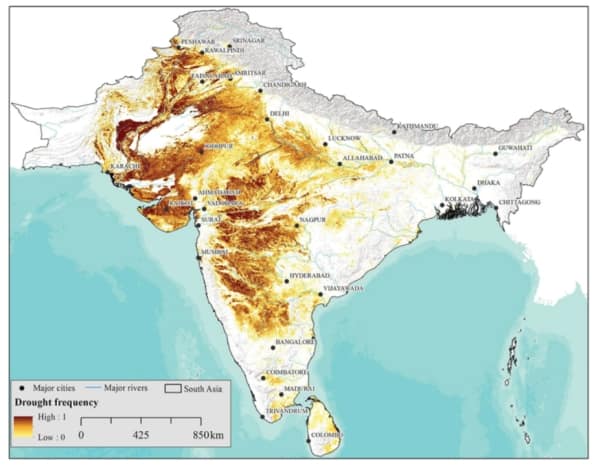
Based on its analysis of risk exposure in these countries, the study shows that approximately 750 million people – over 45 percent of the region´s entire population – were affected by climate hazards during the decade after 2000. Of this total, 72 percent were in India, 12 percent each in Bangladesh and Pakistan, and the remaining 4 percent in Bhutan, Nepal, and Sri Lanka.
Study results emphasize that agriculture is particularly vulnerable to climate extremes (mostly drought and flooding), with more than 58 percent of agricultural areas across the region damaged by multiple hazards. Drought affects the largest area (786,000 square kilometers), followed by extreme temperature, extreme rainfall, floods and sea-level rise.
The IWMI study includes an overall climate change vulnerability map, which makes it easy to visualize and identify climate-hazard hotspots. The results offer few surprises, confirming the common perception that the most vulnerable parts of South Asia are Bangladesh´s coastal region; the Indian states of West Bengal, Orissa, Andhra Pradesh and Gujarat; and Sindh in Pakistan. This is a result of their exposure to sea-level rise and position in the transboundary basins of the Ganges, Brahmaputra and Meghna Rivers, which are prone to annual flooding.
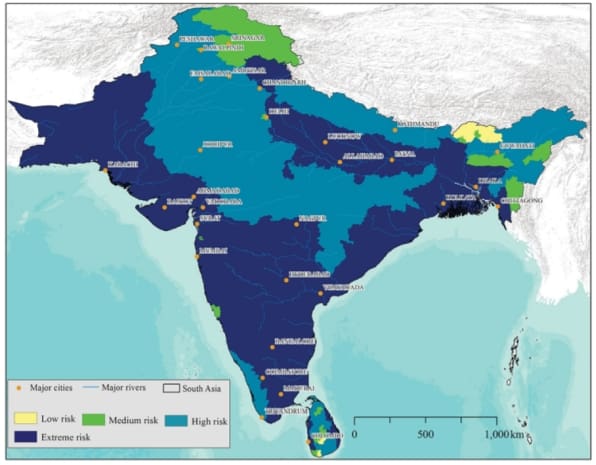
multiple hazards.
From awareness to action
There is growing awareness of the need to prepare for and respond to the impacts of climate change. Finding better solutions to manage disaster risk is crucial for compliance with the Sustainable Development Goals, Sendai Framework for Disaster Risk Reduction and Paris Climate Change Agreement. The methodology that IWMI presents in its new report is a step in the right direction and has potential for application to other regions.
“But much remains to be done toward generating more data on the ground at a finer scale,” says Amarnath. “And this, in turn, requires better coordination among various sectors to develop comprehensive risk assessments that can inform disaster risk management plans and risk-financing strategies.”
Read the report
Amarnath, Giriraj; Alahacoon, Niranga; Smakhtin, V.; Aggarwal, P. 2017. Mapping multiple climate-related hazards in South Asia. Colombo, Sri Lanka: International Water Management Institute (IWMI) 41p. (IWMI Research Report 170) [DOI] | Fulltext (6.07 MB)


